I Ran My COTA Laps Against Verstappen's Pole. I'm at 55% of an F1 Car.
Jul 27, 2026
I Ran My COTA Laps Against Verstappen's Pole. I'm at 55% of an F1 Car.
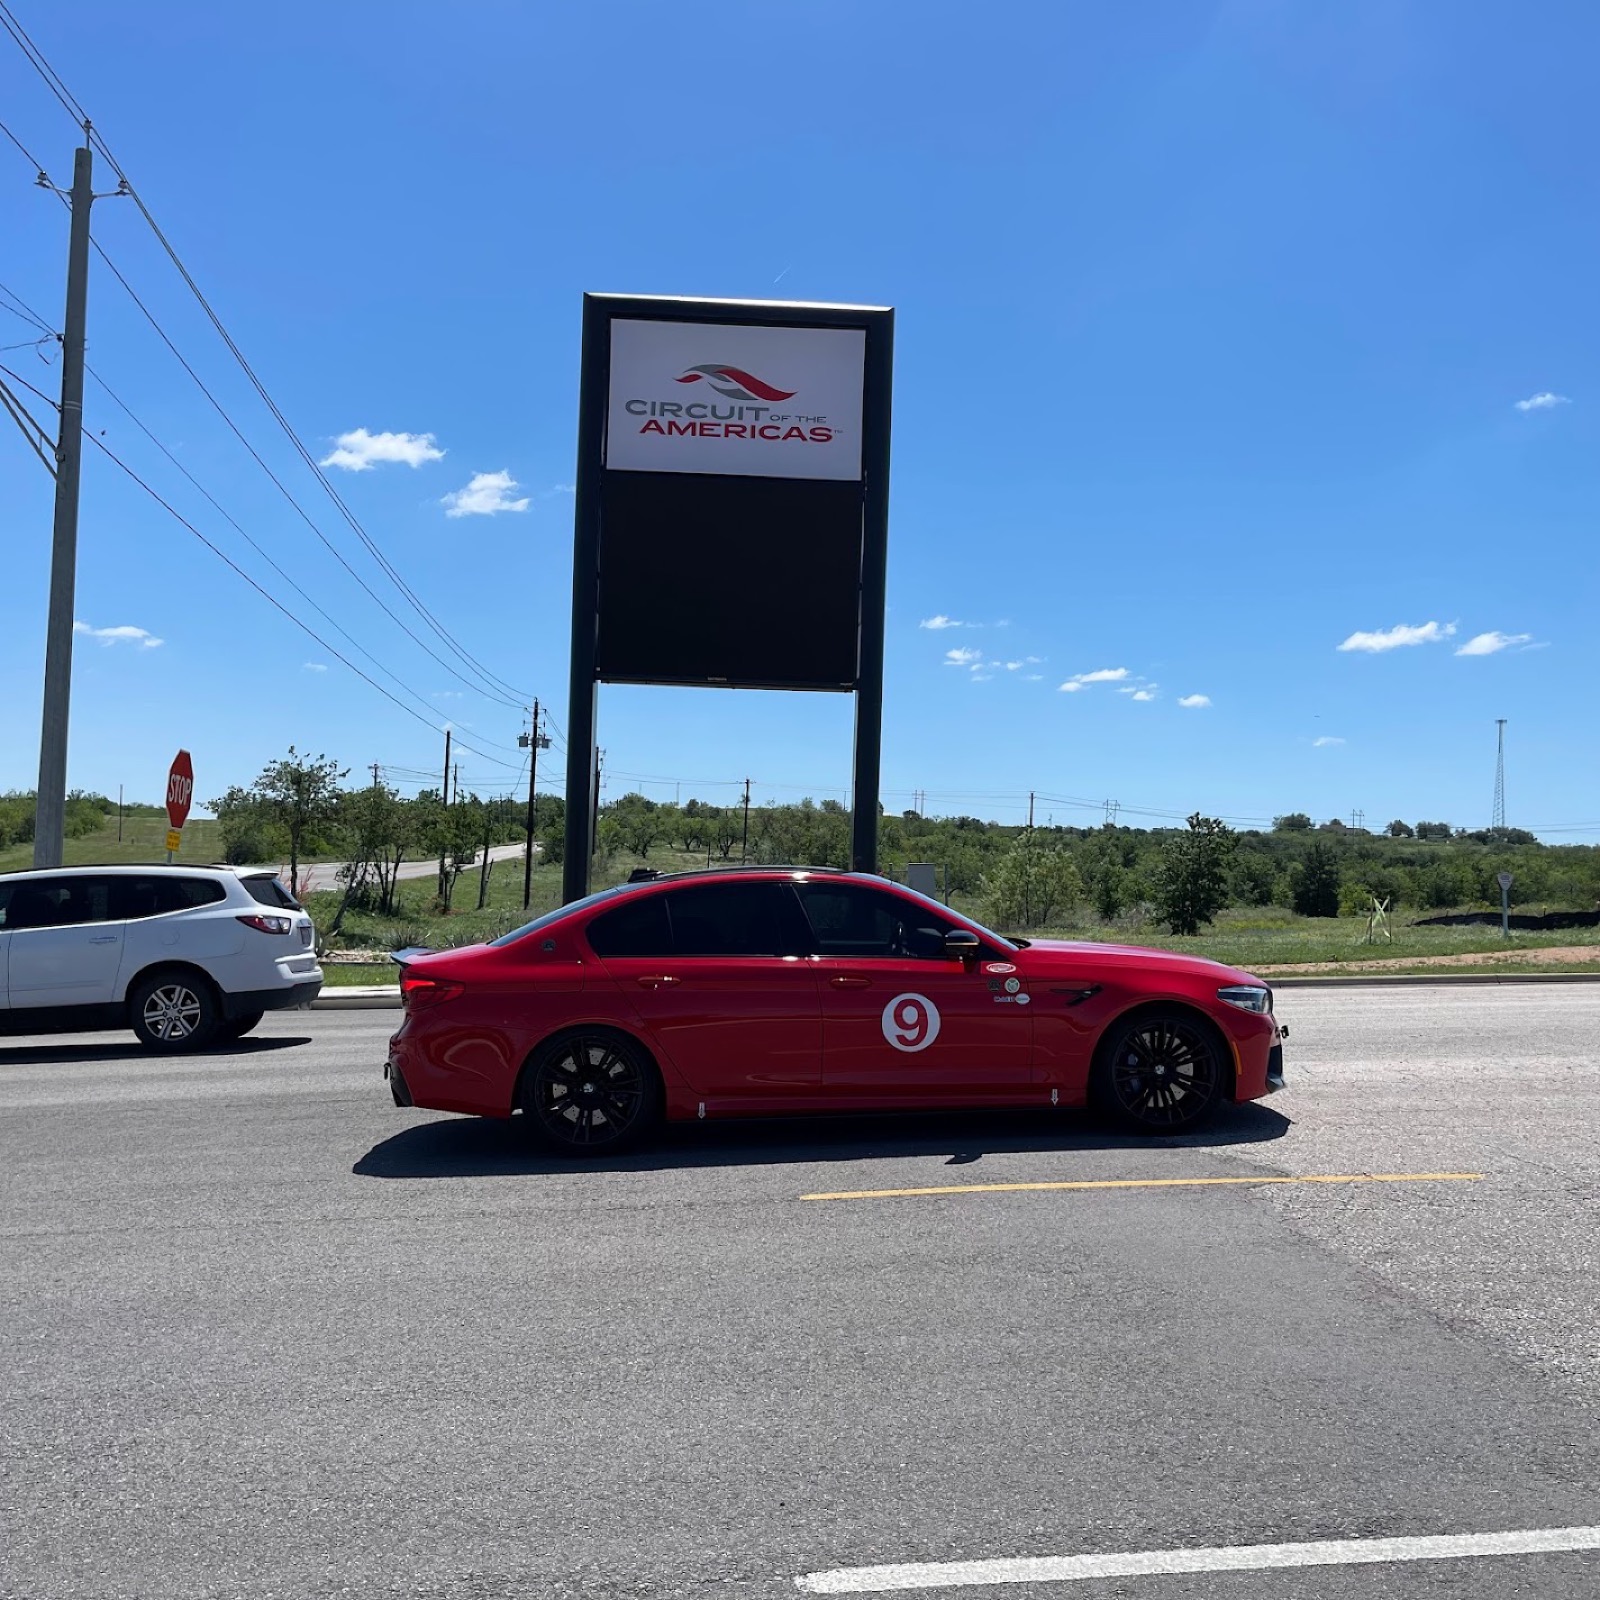
Part of the AI-coached track weekend series. I ran Circuit of the Americas in my BMW M5 in April 2023 — 40 laps across two days, before I was recording anything better than 1 Hz GPS. I'm going back in October with my son Zach. In between, I put three Formula 1 qualifying laps into the same database and pointed them at each other.
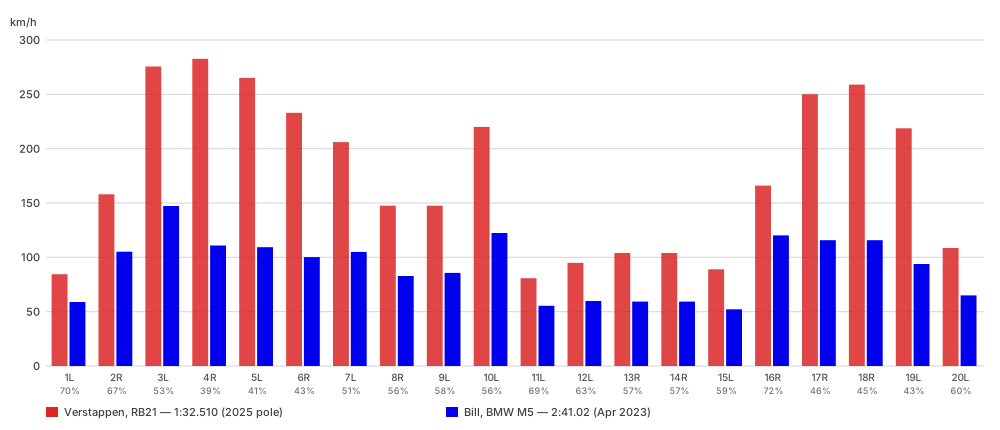
Twenty corners. Slower at every single one. The closest I get is Turn 16, where I'm carrying 72% of his apex speed; the furthest is Turn 4, at 39%. Lap time: 2:41.02 against 1:32.510. He is doing in three laps roughly what takes me five.
None of that is surprising. What's interesting is the two ways I got the comparison wrong before I got it right — both of which would have produced a confident, publishable, completely wrong chart.
First, the data had to exist in the same universe
Formula 1's live timing feed publishes car position ten times a second, as X and Y in a coordinate frame belonging to the circuit. No latitude, no longitude, no published key between the two. Beautiful data, floating in its own private universe.
My database speaks GPS, because every device I own speaks GPS. So the F1 laps were unusable until they were geolocated.
The fix is a technique from robotics called ICP: take the shape of the lap, take the known real-world shape of the circuit (OpenStreetMap has COTA traced node by node), and rotate and slide one onto the other until the mismatch stops shrinking. Run it from twenty-four starting angles so it can't get trapped in a wrong-but-locally-comfortable answer. The winner landed at 10.4 metres of average error across a 5.5 km lap — about a car and a half.
A detail I like: a lap can be fit onto a map correctly or mirror-imaged, and a mirrored fit turns every left-hander into a right-hander. I never told the program which way COTA runs. The mirrored fits simply fit worse and lost. The data settled its own orientation.
The corners, derived rather than typed
I have a rule here, learned the hard way: corner directions are never eyeballed. Not off a track map, not from memory, and above all not from a language model's confident guess — left and right are exactly the kind of thing that gets quietly transposed and then poisons everything downstream.
So direction comes from geometry. Take the car's heading, measure how much it swings through the corner, and the sign of the swing is the answer. Positive is right, negative is left. No opinion involved. Apex is the slowest point.
The numbering is the one thing I don't derive — that's a human convention, and it comes from F1's official corner markers. Conveniently, the Chin Track Days map for October uses the same 1-20, so one set of labels serves both worlds:
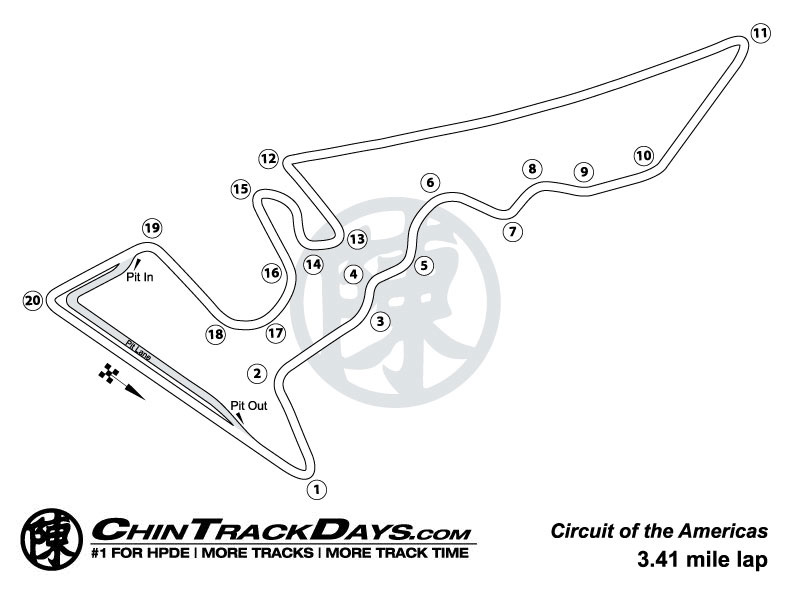
Hold that map against the chart above and the shape lines up: the hairpin at 1, the long esses climbing from 3 to 9, the hook at 11 onto the back straight, the tight stadium section from 13 through 18.
Mistake one: comparing apples at different frame rates
My M5 data is 1 Hz — one GPS fix per second, about one every 33 metres at COTA speeds. The F1 telemetry is roughly 8 Hz, one every 6 metres.
Take "minimum speed near the apex" from both and you are not making the same measurement twice. The dense trace catches the actual slowest instant. The coarse one catches whatever it happened to sample nearby, which is always a bit quicker. Coarse data flatters you, systematically, and only at the slow corners where it matters most.
The fix is to throw data away: decimate the F1 trace down to my sample spacing — every fifth fix — and compare like with like. Both bars on that chart are now measured the same way.
Mistake two: the start/finish line isn't in the same place
This one produced genuine nonsense. My first chart showed me faster than an F1 car at Turn 11 — a hairpin, one of the slowest corners on the circuit. 210% of his apex speed. In a road car.
The cause is boring and easy to miss. Both datasets record distance-around- the-lap, but they don't start counting from the same point: my lap timer's start/finish and F1's timing line are metres apart, and the two sources accumulate distance slightly differently around 5.5 km. Line them up by distance and you are comparing my braking zone against his apex.
The fix is to stop using distance as the anchor and use position instead. Every corner in my database carries the GPS coordinates of its apex, so the question becomes "what is the slowest speed recorded within 45 metres of this point on Earth" — which is the same question no matter whose logger took the measurement, or where it thinks the lap began.
Anchor on position, rate-match the traces, and the impossible results disappear. I'm slower at all twenty. That is how you know the method works: the answer stopped being flattering.
What the numbers actually say
The pattern is the interesting part. I'm closest to him in the slow, technical stuff — Turn 16, Turn 1, Turn 11, all around 70% — and furthest away in the fast sweepers, Turns 3 through 7 and 17 through 19, where I'm at 39-53%. That's not a driver-skill gradient. It's downforce. In slow corners both cars lean mostly on mechanical grip and the gap narrows; in fast ones his car is being pressed into the road by aerodynamic load my M5 doesn't have and never will.
Top speed tells the same story from the other end: 146 mph for me, 201 for him.
There is also a category difference the numbers politely decline to mention. His car exists to do one thing. Mine has this:
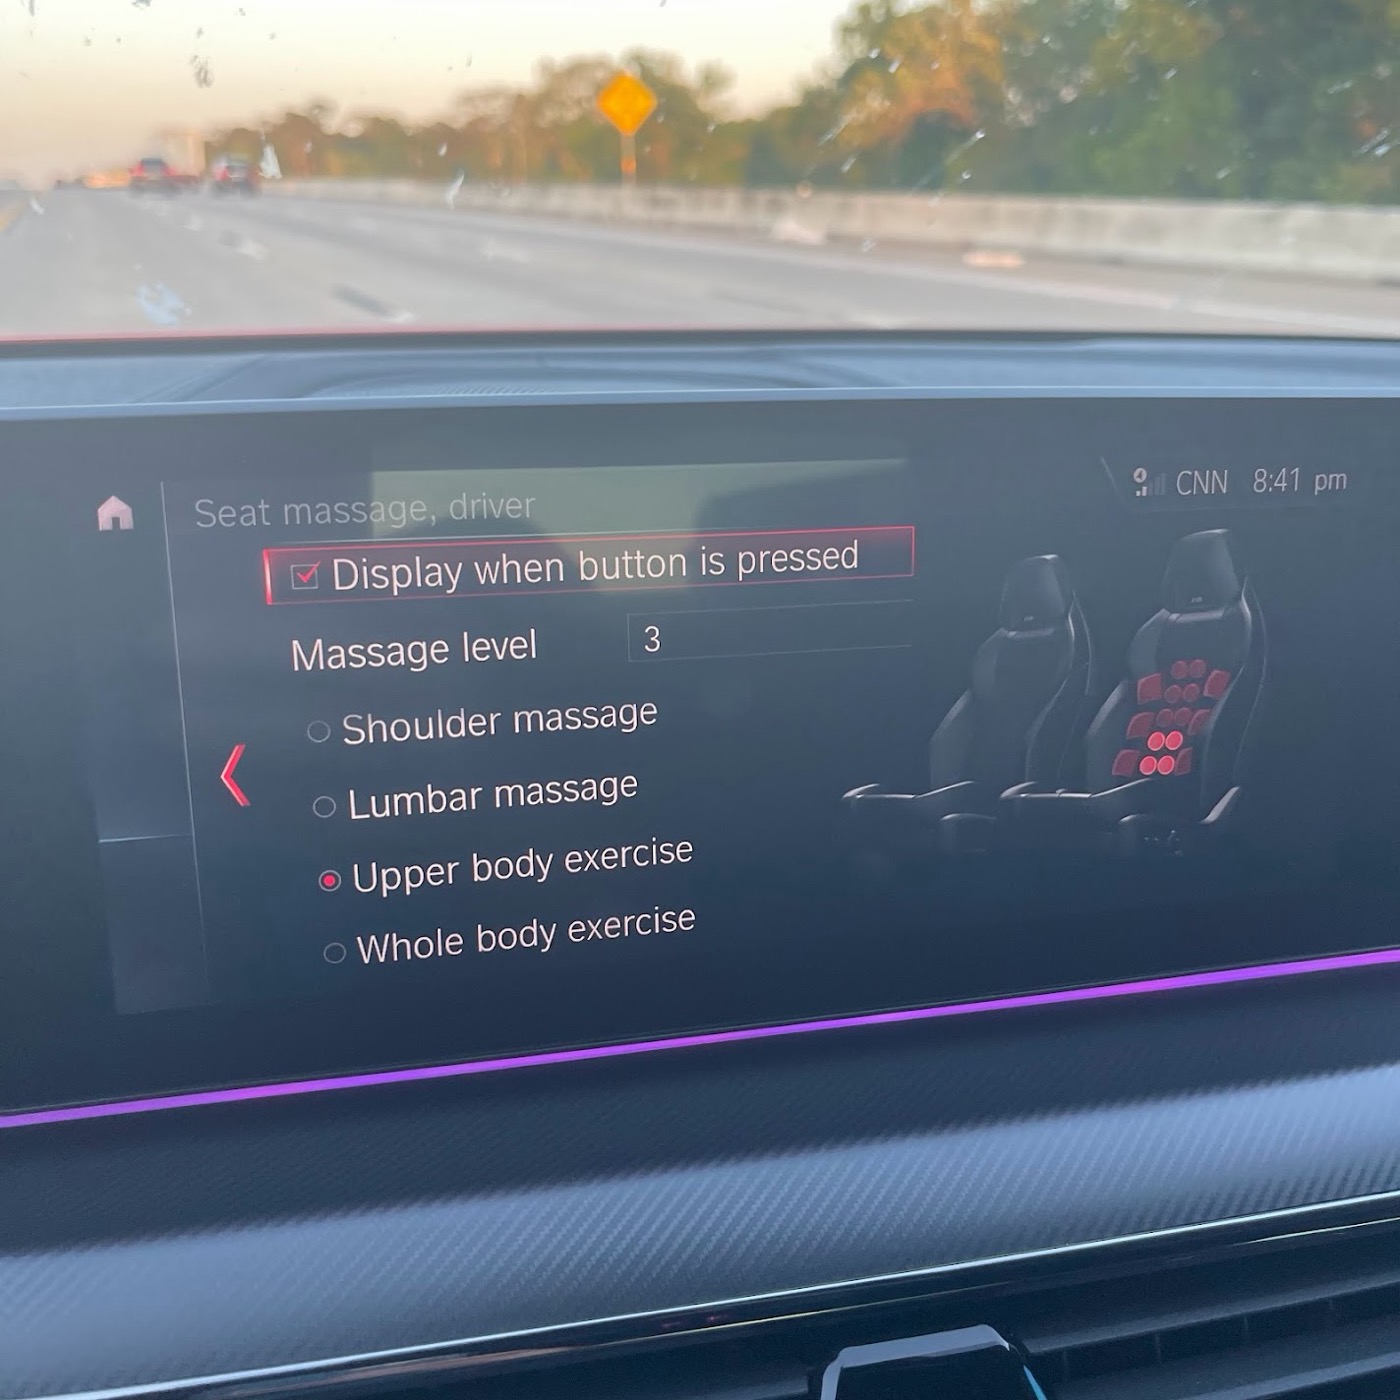
Massage level 3. Upper body exercise. I am reasonably confident Max was not receiving a back rub at 150 mph, which may account for some of the remaining 45%.
The genuinely useful output isn't the ratio, it's the shape of the circuit's demands. Turn 12 is the one to respect — the second-slowest corner on the lap sitting at the end of the longest straight, which makes it the most expensive place all weekend to get it wrong.
One more thing the exercise turned up
While picking a reference lap, I sorted my 40 by lap time and found a 2:34.91 — six seconds clear of everything else I did that weekend. It wasn't a heroic lap. Its GPS coverage was 89% while every clean lap was above 98%: the logger dropped a chunk of the track, so the lap looks short and therefore fast. My validator passed it, because 89% cleared the threshold.
The number sat in my database for three years looking like a personal best. I only caught it because a comparison against a real reference forced me to ask which lap was actually complete. Coverage above 97% is now the bar for a reference lap.
The lap itself
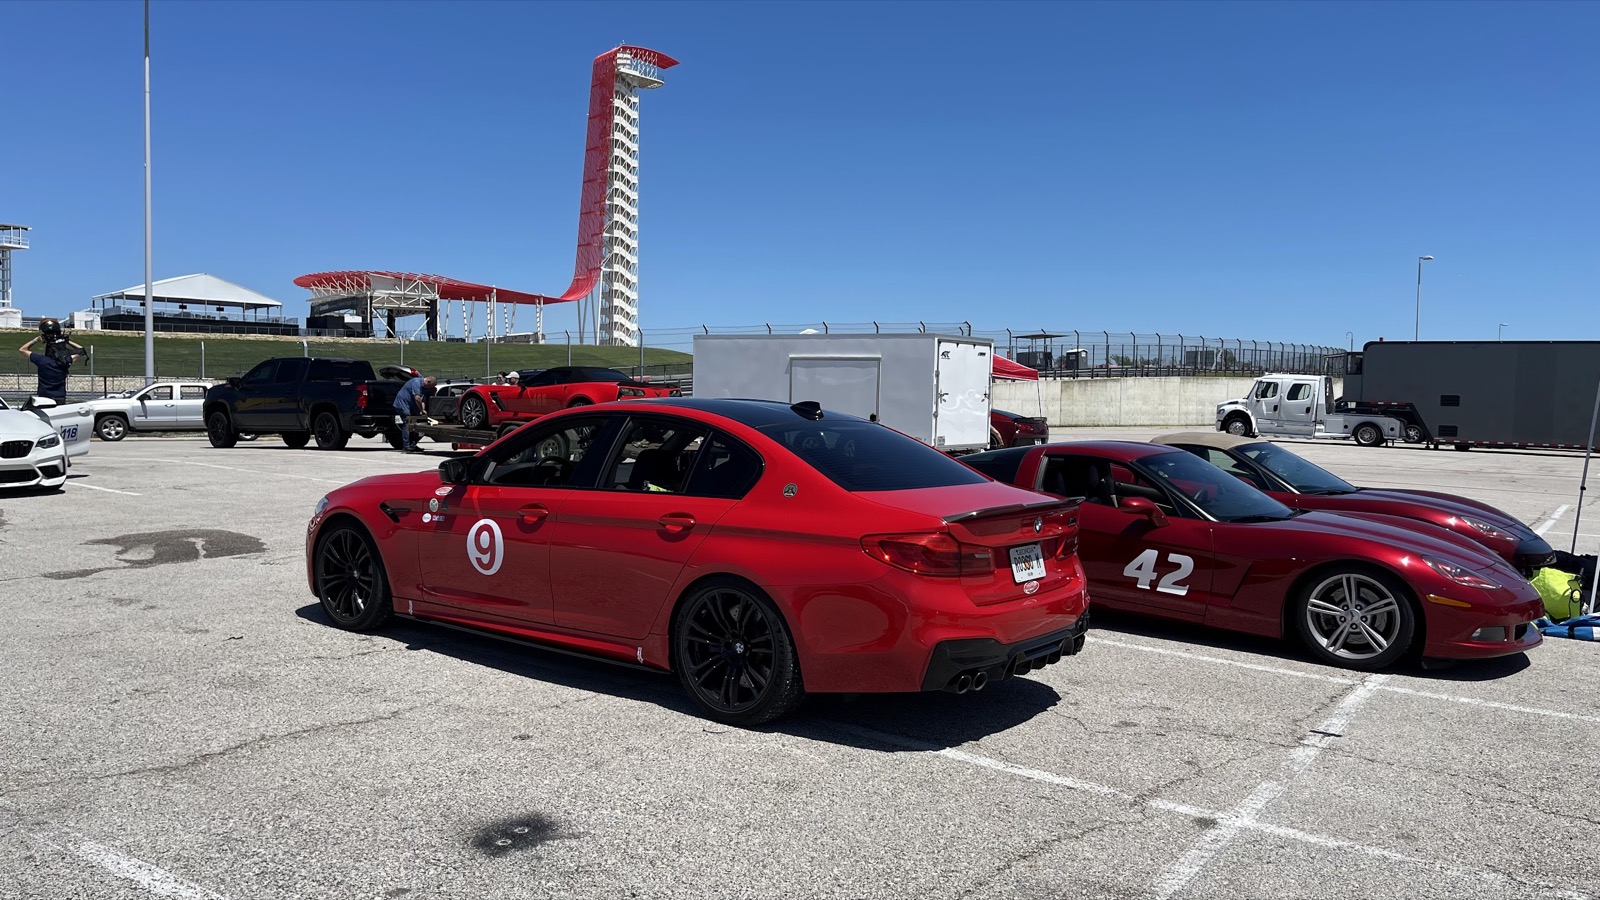
Here's the reference lap — Sunday, 30 April 2023, lap 13, the 2:41.02 every number in this post is measured against.
Come October I'm back, but almost nothing else is the same: it's Zach's Mustang rather than my M5, and I'll be logging at 25 Hz on a RaceBox instead of 1 Hz off a phone. Twenty-five fixes a second is a fix every metre and a half at COTA speeds — dense enough that the apex minimum is the real apex minimum, and no decimation trick is needed to compare against F1 at face value.
Same twenty corners, though. The gap to Max will still be absurd. The gap to my 2023 self is the one I'm actually racing.
Formula 1 timing data accessed via the open-source FastF1 library. This site is unofficial and not associated with Formula 1, the FIA, or any of their companies; F1 timing data remains their property and is used here for non-commercial analysis and commentary. Circuit geometry from OpenStreetMap contributors, ODbL. Reference laps: Verstappen 1:32.510 (2025 United States Grand Prix qualifying), my own 2:41.02 (Circuit of the Americas, 30 April 2023, BMW M5).