You Can't Rent a Race Engineer: A 1:33 at Road Atlanta, and the One Corner That's Against Him
Aug 24, 2026
You Can't Rent a Race Engineer
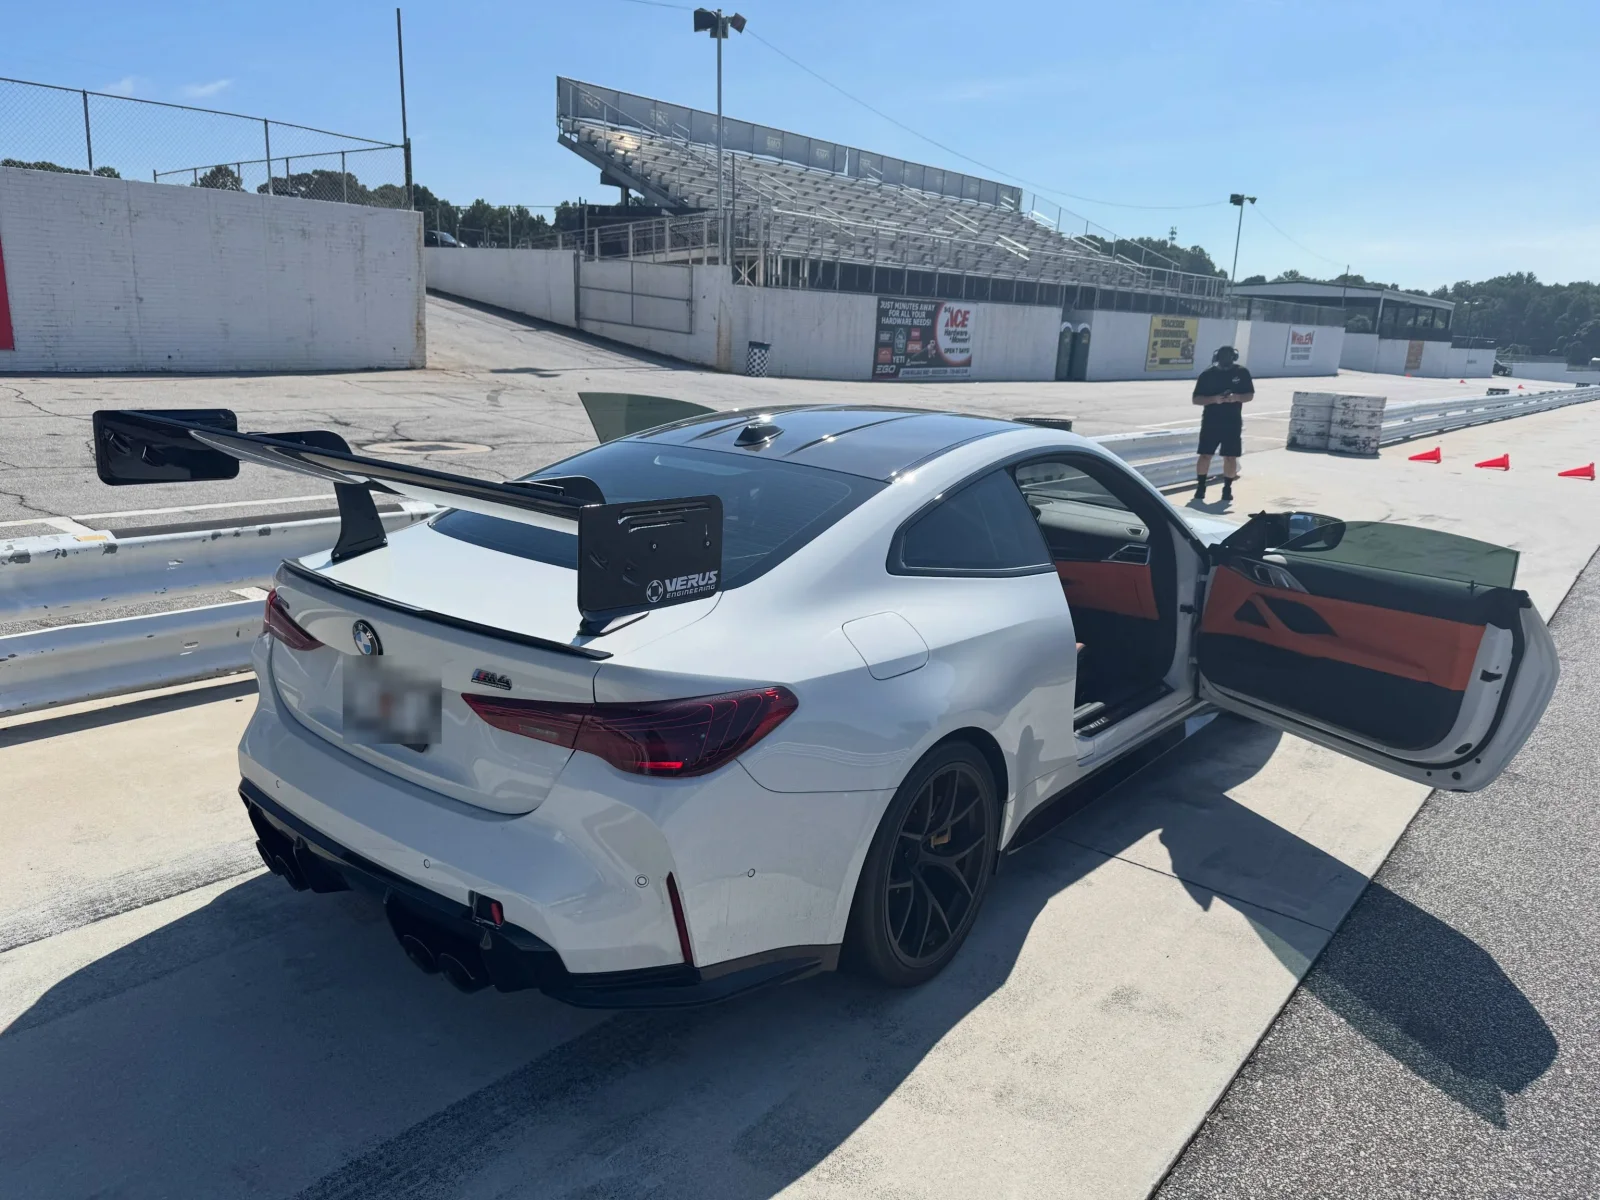
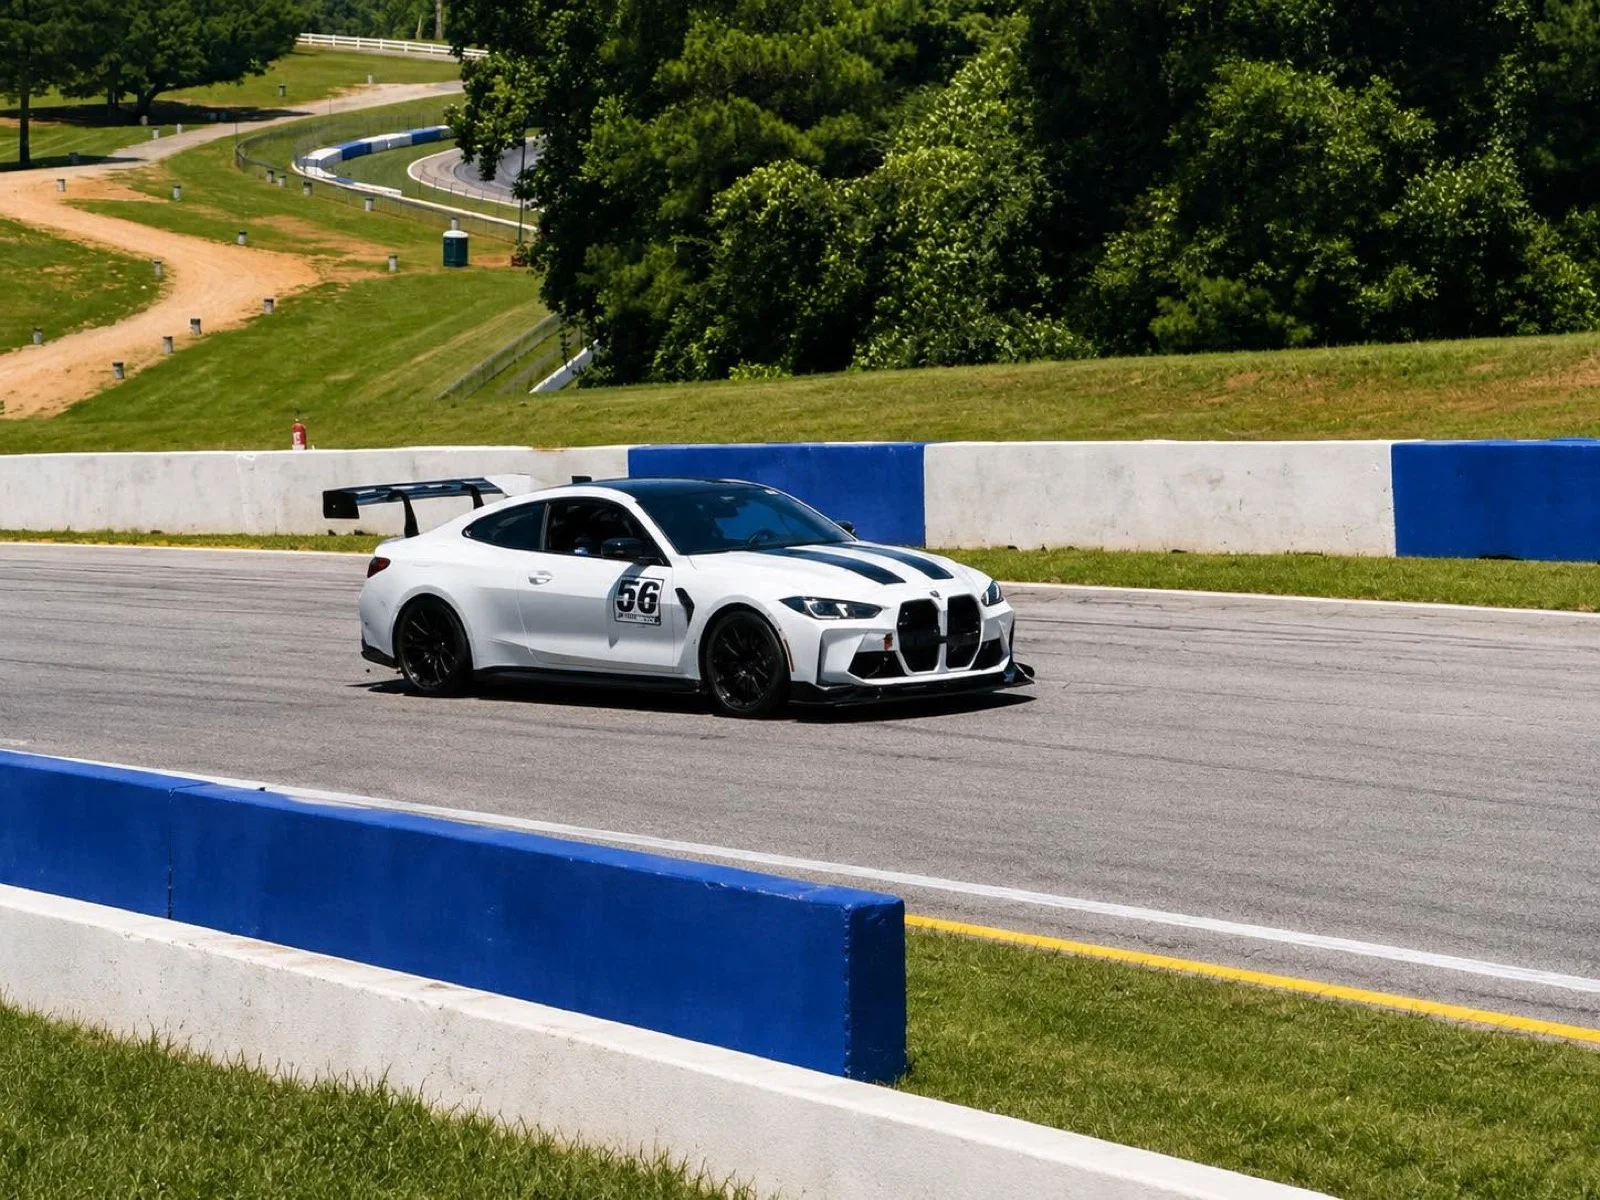 The car that broke my assumptions: JD's M4 Competition at Road Atlanta. Photo his.
AI-coached track weekends · Road Atlanta, August 2026. Earlier in the series: the exact tie, brake later, not less, the heavier car went faster.
James D — JD from here on — turned a 1:33.158 at Road Atlanta and broke something in my dataset.
Not the software. The premise. Every post in this series so far has been about a driver with margin, usually me, being shown where the margin was. At Barber the data said I was braking too much. At VIR it said I wasn't committing to a corner I thought I'd already committed to. Those findings are useful because there was a gap between what I was doing and what the car could do, and the gap was mine.
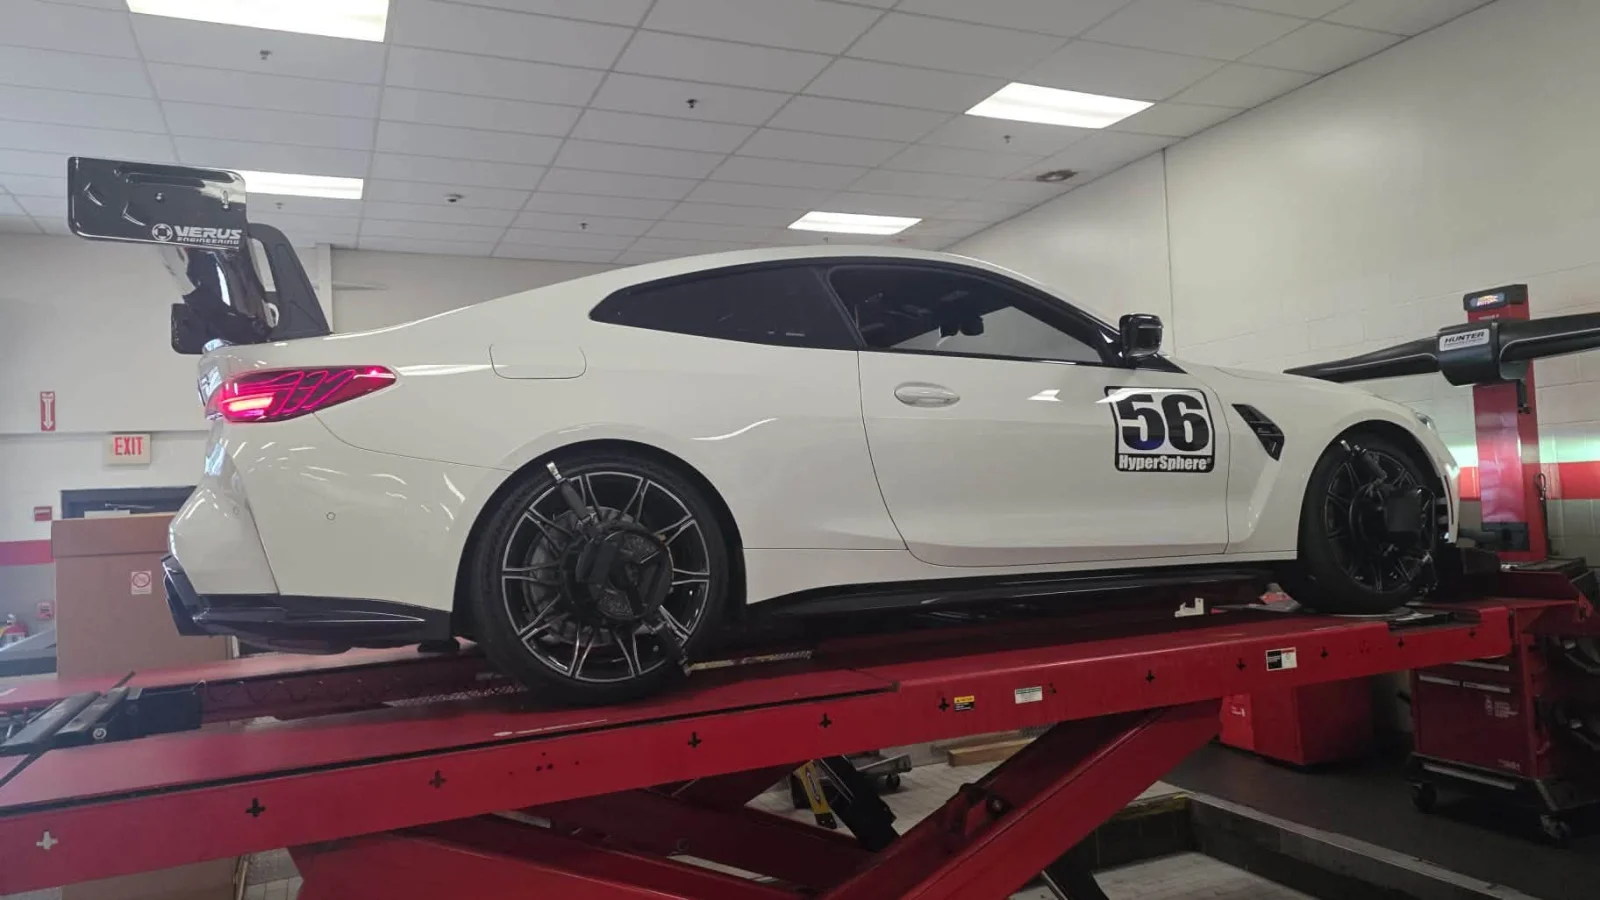 Between test days. The car is developed one problem at a time, which turns out to matter later in this post.
JD has ten years of HPDE and a heavily modified M4 Competition. His lap is 2.042 seconds quicker than the fastest Road Atlanta lap I had on file before he uploaded — a Camaro ZL1 1LE at 1:35.20, out of 1,025 recorded laps by 8 drivers in 16 cars at that circuit. He is not leaving two seconds on the table because nobody told him to brake later. Tell him to brake later and he will, very politely, explain what happens next.
So what do you actually have to say to a driver like that?
Here's the thing: every professional team already knows the answer. A driver at JD's level doesn't stop needing people — he needs different people. A pro coach riding along still finds things (I've watched it happen — at Barber, the AI and a human coach converged on the same three corners independently, which made both more credible, not less). But the other person every fast pro driver has, the one buried in the data between sessions, is a race engineer. Someone who knows the car, knows the track surface, has every lap ever turned, and comes to the debrief with three specific things worth your remaining tenths.
Coaches exist in our world — every Chin and JTI weekend has skilled ones, and any driver at any level should grab that time. Race engineers don't. You cannot rent one for a track day. It's not a service that exists at any price an HPDE driver would pay, because the job is a person-week of data work per weekend.
Unless the data work isn't done by a person.
The thing I got wrong for about a year
For most of building this, I assumed the interesting signal was always in the driver's inputs. Throttle traces, brake ramps, where the steering goes light, how quickly you get back to full power. That's where a novice's time lives, and it's where mine lived too.
But inputs are only half the equation. The other half is the road, and I had been treating the road as a flat ribbon with corners drawn on it — a list of apexes and directions. Which is fine right up until you're talking to someone fast enough that the surface itself is the constraint.
Road Atlanta drops and climbs 123 feet. I have said that in three previous posts as a piece of trivia. It turns out to be the whole story, and I had no numbers for it.
Fifteen million points, free, in seven seconds
The United States government flew a LiDAR survey over Braselton, Georgia, and put the point cloud in a public S3 bucket. That is the entire acquisition strategy. USGS 3DEP covers about 94% of the country's landmass, it's public domain, and it's stored as an addressable octree — so you don't download the terabyte-scale project, you download the box around your racetrack.
Road Atlanta cost me 397 octree nodes, 15,055,375 points, 98.7 MB, and 7.7 seconds. Storage runs about a third of a cent a month.
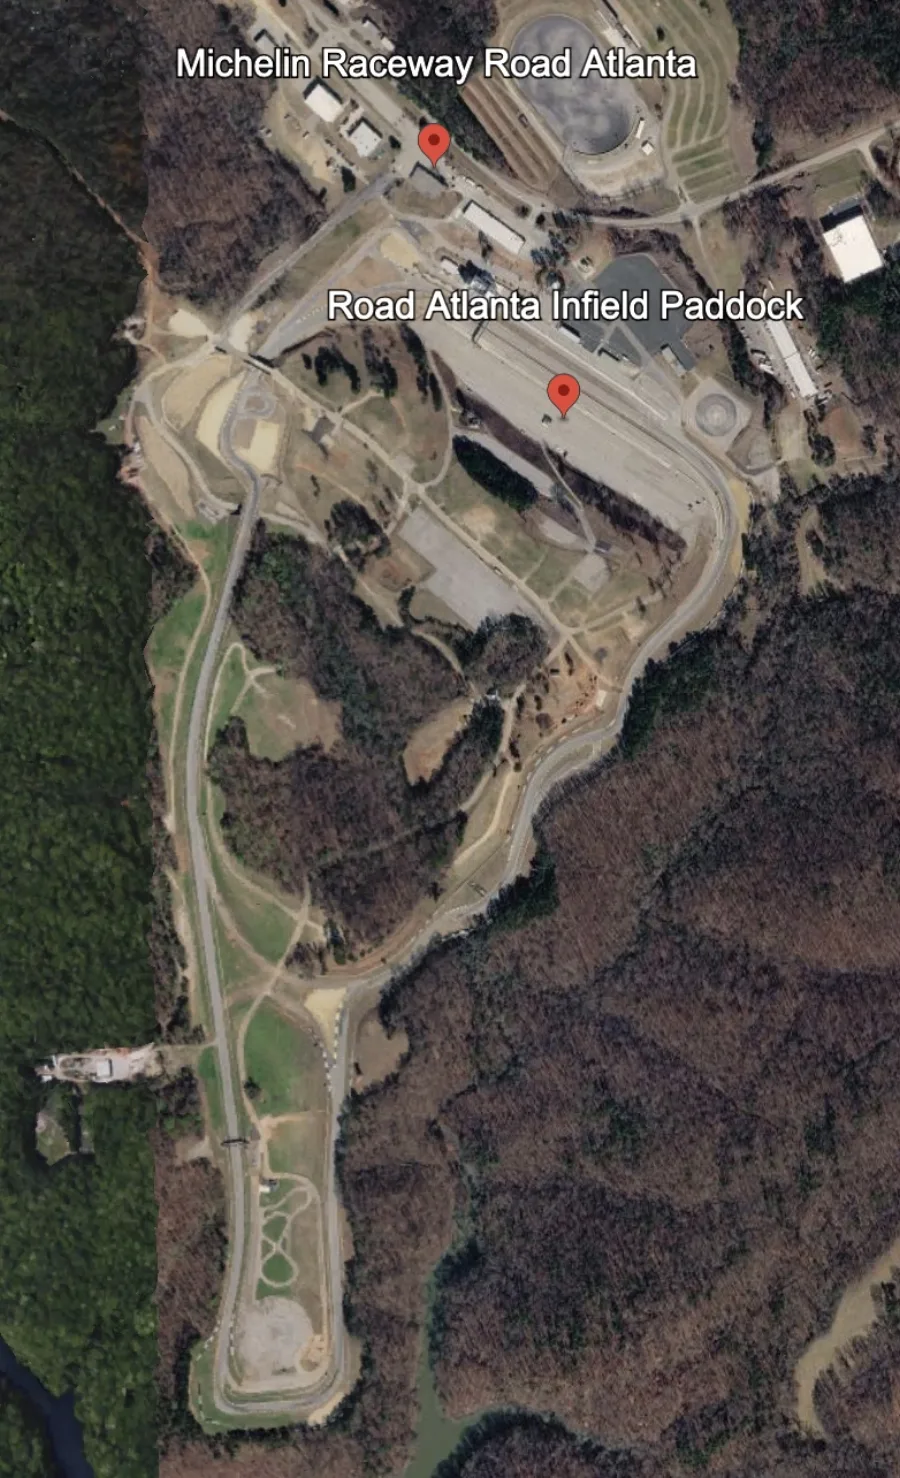 The box I asked for. Everything inside it came back as points — asphalt, run-off, paddock and all — and the racing line is what selects the asphalt back out.
Then the part that matters. Take one of my own clean laps — 2,516 GPS fixes at 25 Hz, my Z4 M40i, 1:40.530 — resample it onto stations every five metres, and at each station fit a plane to the ground returns in a slab across the track. That gives you the cross-slope, the grade, and the vertical curvature of the actual asphalt, along the line a car actually takes.
785 stations. 779 of them fitted. Median residual of the plane fits: 2.16 centimetres. Real track camber runs one to five percent, so the measurement sits a couple of orders of magnitude above its own noise.
The part where I try to prove myself wrong
A derived number you can't check is a number you shouldn't publish, so the rule is that a new track has to reproduce something already known before anything else it says is allowed to count.
Before running it, I wrote down one fact: Turn 1 at Road Atlanta is banked. I know that from driving it, not from data.
Turn 1 came back at +2.65% at the apex, +4.49% at its maximum, classified on camber. The character came out of the survey rather than having to be put into it. Same gate Barber passed earlier this summer, where the corner I know as Charlotte's Web measured −1.76% — off camber, exactly as it feels.
Good. Now the things I didn't know.
Road Atlanta helps you almost everywhere
Of 492 station measurements inside canonical corners, only 89 read negative — 18.1%. Fourteen of the fifteen rows in our Road Atlanta corner table have positive camber at the apex.
Turn 6 is the most banked corner on the track: +8.55% at the apex, +6.54% averaged across the corner, peaking at +9.11%. That's the same class as Barber's Turns 2 and 3, and Barber is a circuit people describe as banked. It's a medium-speed uphill right, so the banking is doing its work exactly where lateral load is high.
Turn 10a is the only corner with a negative apex camber — −2.93%, reaching −3.51%, the most adverse cross-slope anywhere on the circuit. And it climbs while it does it, from +1.5% to +9.94%. Off camber and steeply uphill at essentially constant speed: the climb loads the car while the cross-slope unloads the side you're leaning on, and neither braking nor throttle is there to arbitrate.
And there's a transition I'd never have written down. Turn 6 ends with the surface still supporting you; then the cross-slope through Turn 7 goes negative, to −1.50%, and Turn 7's entry is the heaviest braking zone on the lap — 73.9 mph down to 44.0 in about 60 metres, the slowest point on the circuit. You leave the most banked corner at Road Atlanta and, fifty metres later, do the biggest deceleration of the lap on a surface that has stopped helping.
Now put a fast car on it
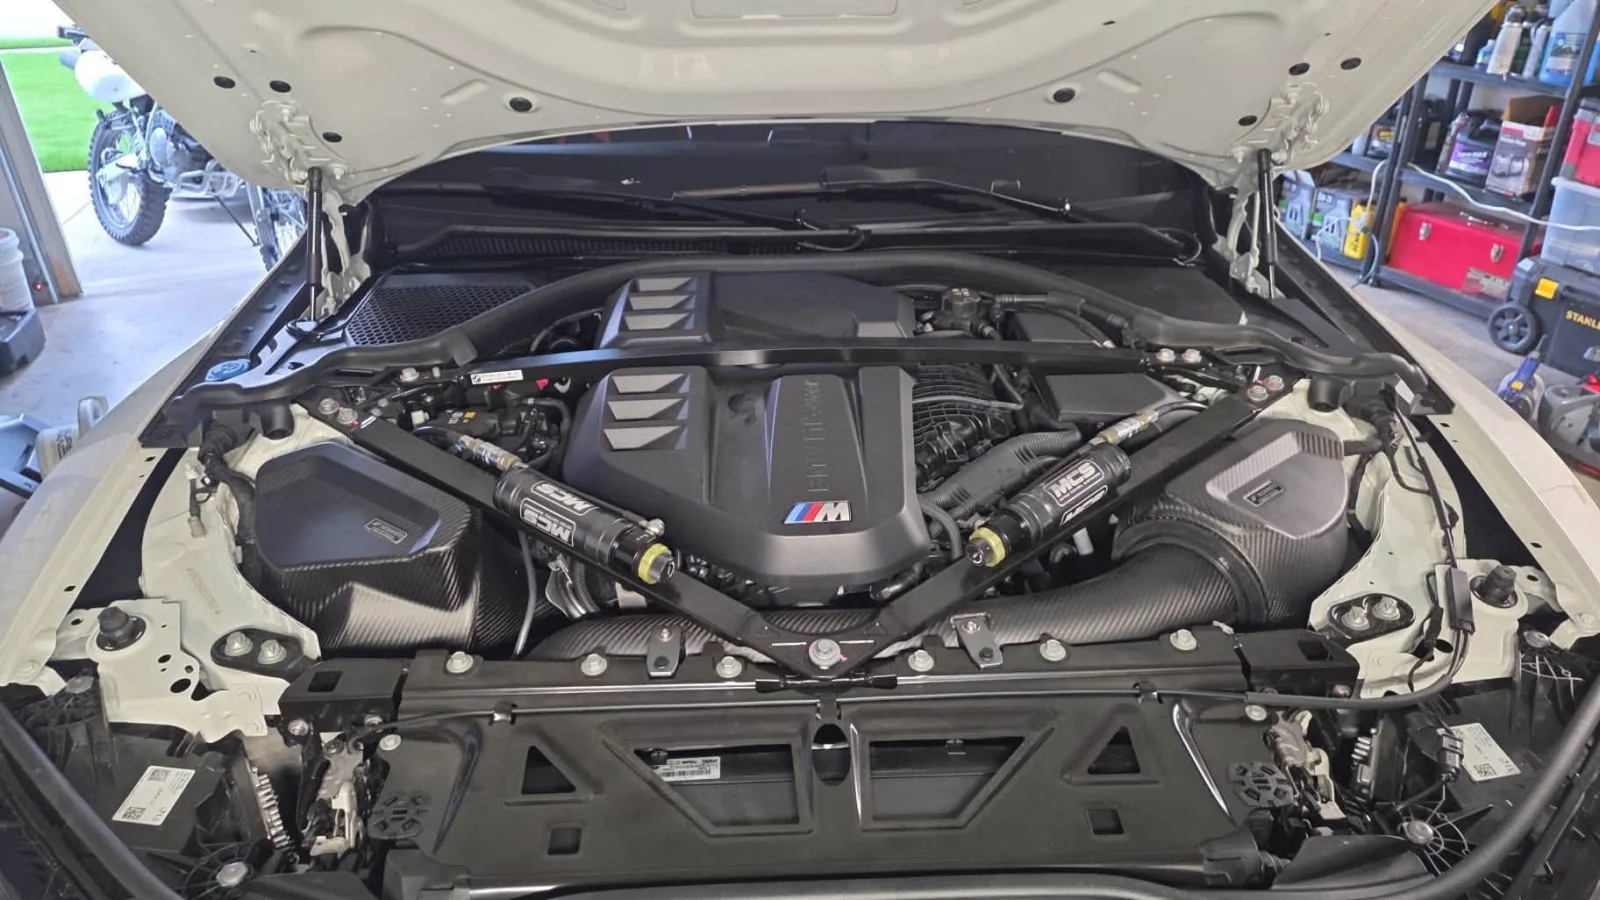 MCS three-way dampers, SPL chassis parts, carbon intakes. "Heavily modified" is doing a lot of work in that sentence.
Here is JD's best lap against mine, average speed by zone. Same circuit, same corner definitions, seven seconds apart.
| Zone | JD | Me | Δ | share of his straight-line edge |
|---|---|---|---|---|
| Back straight | 138.5 mph | 126.0 | +12.5 | — |
| T10b crest | 82.0 | 73.3 | +8.8 | 70% |
| Esses | 100.8 | 92.2 | +8.6 | 69% |
| T11 / T12 | 103.2 | 95.1 | +8.1 | 65% |
| T6 (most banked) | 75.3 | 71.3 | +4.0 | 32% |
| T7 (slowest) | 61.9 | 59.0 | +2.9 | 23% |
| T1 (banked) | 90.7 | 89.0 | +1.7 | 13% |
| T5 crest | 73.5 | 72.0 | +1.5 | 12% |
| T10a (only off-camber) | 57.3 | 56.2 | +1.1 | 8% |
A car worth 12.5 mph on the back straight is worth 1.1 mph at Turn 10a. The place where his advantage almost completely disappears is precisely the corner the survey flagged as off camber and steeply climbing. Turn 10a is grip-limited by the road itself, and a better car barely helps. That isn't a criticism of his driving; it's the shape of the asphalt.
Turn 6 is the interesting one. The most banked corner on the circuit, +9.11% of support available, and he converts only 32% of his straight-line advantage there — against 69% in the Esses and 70% at T10b. In the fast flowing sections his car advantage lands almost fully. In the one corner that's actively handing him extra grip, it lands a third of the way.
That's what the data adds for a driver who's already fast. Not brake later — "there is nine percent of banking in Turn 6 and you're using a third of what it's worth to you." It's checkable, it's specific, and it came from measuring the road. It's also, not incidentally, a perfect thing to take to a coach: here's the corner, here's the number, ride with me and tell me what you see.
The strangest number in the set
At the Turn 5 crest — station 1,380 m, the steepest climb on the circuit at +11.1% — JD is doing 68.0 mph and I am doing 67.9.
Identical. Everywhere else on the lap he's travelling 1.1× to 1.27× my speed. At the one place the road goes most sharply uphill into a crest, a 1:33 M4 and a 1:40 Z4 are going the same speed. Whatever is setting the limit there, it isn't the car.
What the road does to him, specifically
I promised these numbers would be re-derived from his own trace rather than scaled off an average. Vertical load from a crest or a compression goes with the square of speed, so the same asphalt does more to a faster car:
| Feature | Me | JD | JD's load |
|---|---|---|---|
| Esses compression (1,160 m) | 96.4 mph | 104.1 | +0.43 g (mine: +0.37) |
| Chicane crest unload (3,620 m) | 87.6 | 98.7 | −0.40 g (mine: −0.32) |
And the crest sequence on the run to the flag is worth seeing laid out, because the survey puts three things within a hundred metres of each other: the highest point on the circuit at 3,560 m, a −0.40 g unloading at 3,620 m, and the steepest descent on the track, −17.04%, at 3,660 m. He crosses the summit, goes light by four tenths of a g, and the road falls away underneath him — while accelerating through 103 mph.
That is not a driving error, and there's no technique note for it. But you can name it, and put a number on it, and that turns "the car felt weird there" into "you went 0.40 g light there, forty metres before the road drops seventeen percent." Which is exactly the kind of sentence a race engineer hands a driver before a session.
The other three seconds
 Same car, same driver, two days — and three seconds. Nothing you can see from here explains it.
JD ran two days. Day 1: six hot laps, 1:33.158 to 1:35.930. Day 2: three hot laps, 1:36.216 to 1:38.963. 3.06 seconds slower, same driver, same car.
But day 2 set the higher top speed — 156.2 mph against 154.5.
That combination is diagnostic, and the per-zone time budget makes it unambiguous:
| Zone | Day 1 | Day 2 | Lost |
|---|---|---|---|
| T2 / T3 / T4 | 14.16 s | 15.08 s | 0.92 |
| T5 and approach | 14.08 | 14.60 | 0.52 |
| Esses | 5.96 | 6.40 | 0.44 |
| Start → T1 exit | 10.12 | 10.52 | 0.40 |
| T7 | 6.84 | 7.16 | 0.32 |
| T6 | 4.92 | 5.20 | 0.28 |
| T10b crest | 4.48 | 4.60 | 0.12 |
| T11 / T12 | 6.48 | 6.56 | 0.08 |
| T8 + back straight | 22.12 | 22.12 | 0.00 |
| T10a | 4.16 | 4.16 | 0.00 |
Every millisecond of it in corners. Zero on the straight. More top speed, less cornering speed — that is a grip problem, not a power problem.
So I went and got the weather. Both sessions, hourly, from a free public reanalysis archive, cross-checked against the METAR at the airport twelve miles away (they agreed on air temperature to 0.7 °F):
| Day 1 — 1:33.158 | Day 2 — 1:36.216 | |
|---|---|---|
| Session, local | 4:40 PM | 10:35 AM |
| Air | 95 °F | 82 °F |
| Surface proxy | 95.5 °F | 81.3 °F |
| Humidity | 41% | 75% |
| Rain | 2.3 mm at 7–9 AM, 0.3 mm at noon — stopped 2½ hours before | 0.6 mm overnight |
The hot day was the fast day. Day 2's cooler, denser air made more power, which is the higher top speed. Day 2's colder surface — rained on overnight, rubber washed off, first session of the morning — cost him grip in every single corner and nothing at all on the straight.
His day-2 deficit was thermal, not technique. That's a very different conversation from "you were three seconds off," and it's one I could only have because the conditions and the corner geometry were both sitting in the same database as the lap.
It generalises, too: a cooler day is faster in a straight line and slower everywhere else. If a session shows more top speed and less pace, look at the weather before you look at the driver.
The 1.4 seconds he has already driven
One more thing the data will do for a fast driver, and it's the one I'd act on first.
Take his six hot laps from day one, cut them at the corner boundaries, take the quickest version of each section he actually drove, and add them up. That's a theoretical best — not a simulation, not a model. Every piece of it is something he did, on that day, in that car.
1:32.08. Against an actual best of 1:33.158.
1.08 seconds sitting in laps he has already driven, and all six laps contributed a fastest section — no single lap dominates, so this isn't one freak lap flattering the number.
Where it is, and this is the part I didn't expect:
| Zone | His best ever | On his best lap | Available |
|---|---|---|---|
| Start → T1 exit (incl. front straight) | 9.72 s | 10.12 | 0.40 |
| T8 + back straight | 21.76 | 22.12 | 0.36 |
| T11 / T12 to the flag | 6.32 | 6.48 | 0.16 |
| T2 / T3 / T4 | 14.08 | 14.16 | 0.08 |
| T10a · T10b | — | — | 0.04 each |
| Esses · T5 · T6 · T7 | — | — | 0.00 |
His mid-corner is already maxed. Through the entire technical middle of the circuit — the Esses, Turn 5, the most banked corner on the track, the slowest corner on the track — his best lap was his best, in every one of them. There is nothing there to reclaim.
Every available tenth is on the two straights. Which means it isn't straight-line speed at all: it's exit speed out of Turn 7 and out of Turn 12. Two corner exits, 0.76 seconds, and they're the difference between a 1:33 and a 1:32.
That's the shape of the answer for someone this quick. Not a list of corners to work on — a list of one, arrived at by elimination, with the other thirteen positively ruled out by his own driving. Nobody produces that from the passenger seat in real time, and no driver produces it about themselves from memory — it's a database job. It falls out of having every lap and asking which slices were quickest. And it's the single most useful thing you could hand a coach before a session: not "make me faster," but "these two exits, everything else is done."
(A note on that arithmetic, because I got it wrong first. My initial pass sliced the lap into forty equal pieces instead of cutting at the corners, and reported 1.40 s. Slice it into eighty and you "find" 1.76; into a hundred and sixty, 2.68. It never converges — which is the tell that past a certain fineness you are no longer finding time, you are harvesting GPS noise and slightly different lines between laps. Cut at real corners and it settles at 1.08 s. That's the number above. The finer figures were mine, briefly, and they were wrong.)
What I don't know, and what I got wrong
The honesty beat, because these posts get one.
I wrote a wrong version of this post first. My first draft said Turn 6 was the slowest corner on the circuit and that Turn 10a was the heaviest braking zone. Both sounded right. Both came from a note I'd written weeks earlier, from memory of how the place feels. Both were false — Turn 6 runs 75 mph, and the slowest point and the hardest braking are both in Turn 7, sixty metres later. I only caught it because every number in a post gets re-derived from the data before it publishes, including the numbers I'm confident about. That rule is the actual product; the LiDAR is just an input.
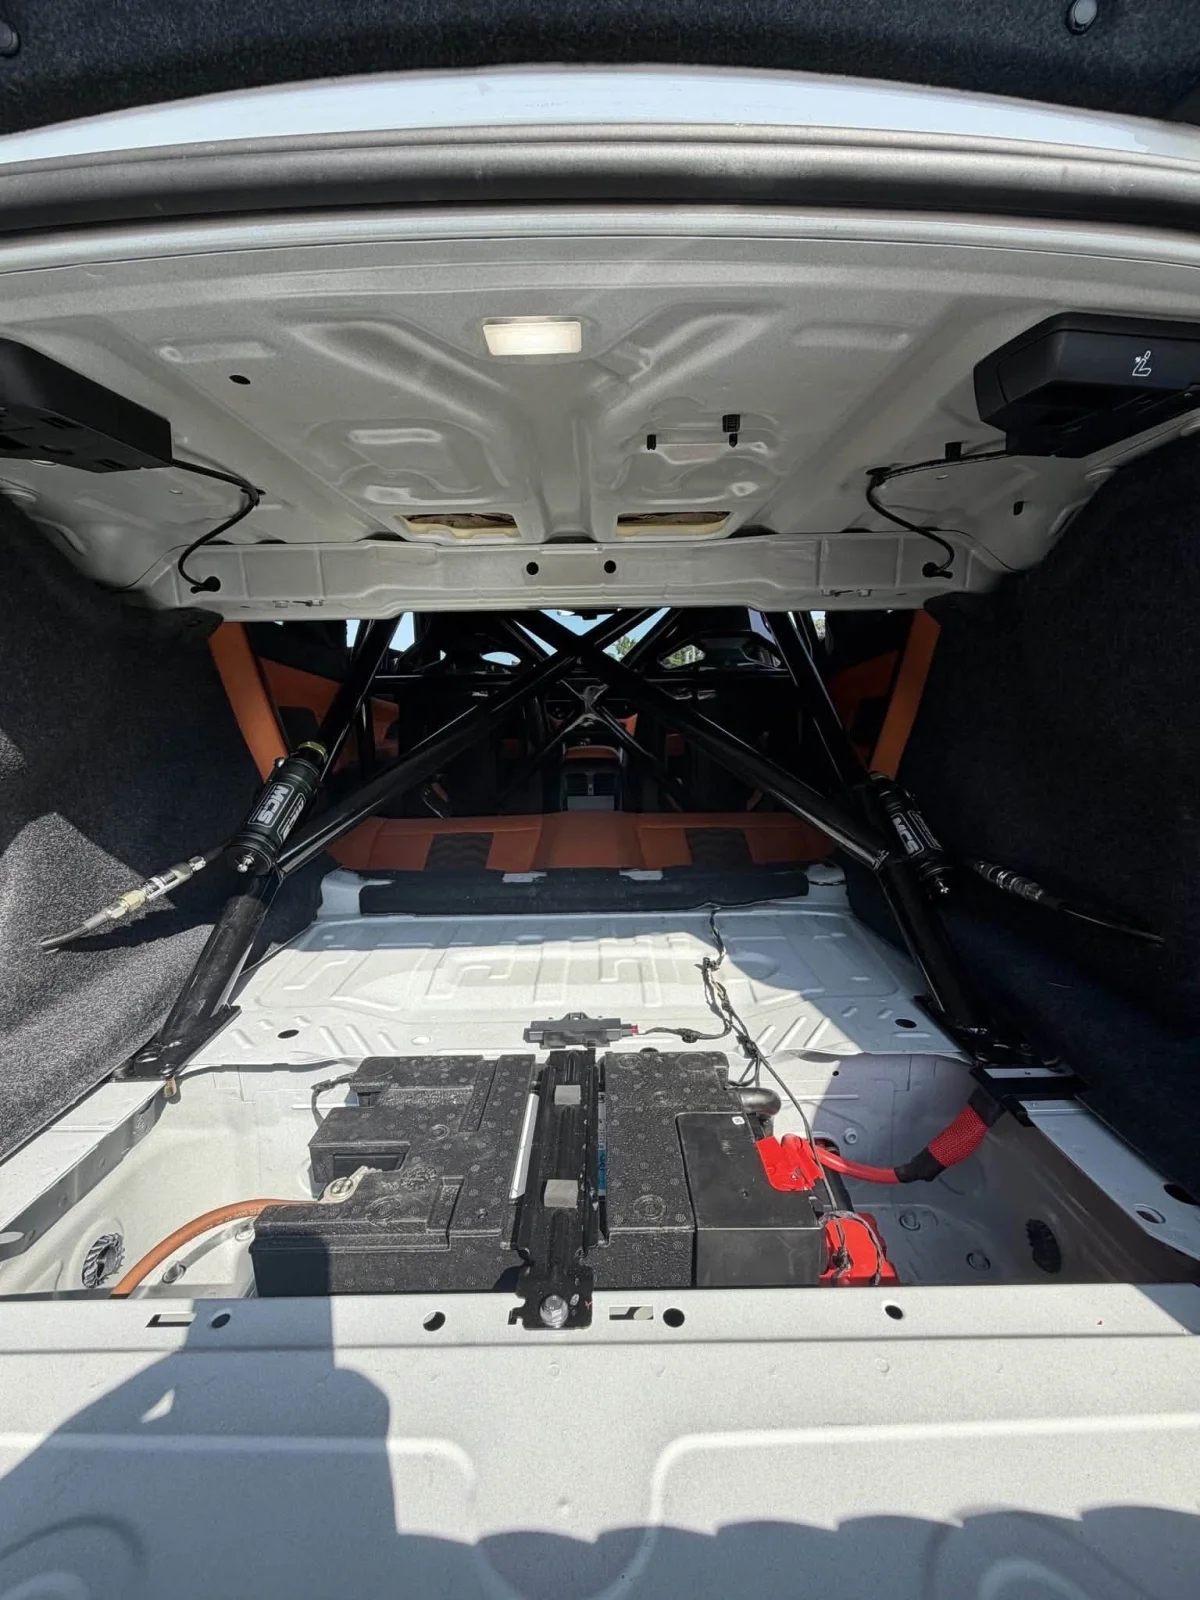 Cage bracing and the rear MCS units. The car is instrumented to within an inch of its life mechanically — which makes the next bit more annoying.
JD's data is GPS only, and that turned out to be a bug rather than a choice. Speed, position, elevation — no throttle, no brake, no g-channels. Everything above is derived from where the car was and how fast it was going.
The throttle and brake are simply explained: no OBD link. The missing g-forces are more interesting, because he had a RaceBox Mini in the car the whole time, and it carries an ±8 G accelerometer and a ±320 dps gyroscope. The data should have been there.
Here's what I found when I went looking. RaceChrono derives its lateral and longitudinal g channels from an IMU source — the phone's own sensors, or the RaceBox's. If no IMU source is active, those columns still appear in the export and are simply empty. No error. No warning. Twelve laps of a channel he owns the hardware to record, and the first anyone knew was me querying a database a week later and getting 2,333 nulls.
That's not JD's mistake. It's a class of failure I should be catching at ingest and telling him about the same evening, while the car is still at the track and the setting is still fixable. It's now on the list, along with something simpler: the next upload should be the native session file rather than a CSV export, because a CSV is only whichever channels the export happened to include, and the native file is everything the app actually recorded. You can't recover a channel that wasn't saved, and you can always re-derive from a file you kept.
The encouraging half: a phone and a pocket-sized GPS receiver produced every number in this post.
The absolute elevations here don't travel. The LiDAR surface at Road Atlanta sits 1.69 m below my lap's GPS elevation; at Barber the same comparison came out 0.48 m above. That's a vertical datum difference, not noise, so Road Atlanta can be measured against itself all day but its absolute heights can't be compared to Barber's without reconciling the surveys.
And ingesting his laps found two bugs of mine. His distance channel counts from the start of the session rather than the start of the lap, which quietly breaks every distance-aligned comparison until you notice the bin numbers are strange. And his driver page is currently reporting his lap consistency as 12.0% — because the statistic is including his in-laps and cool-down laps. Over his six real day-one laps it's 1.23%, which is an excellent number, and I'm publishing the wrong one. Both are filed. Neither would have surfaced without a fast outsider's data landing in it.
The point
A driver at JD's level deserves what every pro driver gets: a coach's eyes and a race engineer's numbers. The first one he can get — Chin and JTI put skilled coaches within reach of every driver on every weekend, and at this level that time is worth more, not less, because the remaining problems are subtle. The second one he couldn't get, at any price, until his data landed in a database that already held the track's LiDAR, a thousand laps of context, and the weather.
Look at what the race-engineer half handed him from one lunch-break upload: Turn 6 is offering nine percent of banking he's using a third of. Turn 10a is the only corner on the circuit tilted against him. He goes four tenths of a g light forty metres before the biggest drop on the track. Three of his missing seconds on Sunday were sitting in an overnight rain shower rather than in his hands. And of fifteen corners at Road Atlanta, there are exactly two exits where he has time left to take.
That last one is the shape of the whole thing. Thirteen corners ruled out — not by opinion, but by his own driving having already produced the best version of each. What's left is small, specific, and checkable — and if he takes those two exits to a coach next weekend, the coach starts the session already knowing where the time is. The two halves make each other better.
That's the job: race engineer for drivers who could never rent one.
Next up
Two threads. Turn 6 in detail — real lateral g, once we've got his IMU recording, measured against the +9.11% of camber sitting there unspent, and what the banking is worth in lap time if he takes all of it.
And the arithmetic on where this actually ends. He's at 1:33.158 with 1.08 free in consistency, which is a 1:32 without changing a thing about how he drives. Turn 6 is worth something beyond that but not a lot — it's a short corner, and I'd put it near a quarter second. After that you run out of driver and start needing car. He has mentioned the 1:20s. I'd like to find out how wrong that is.
Got track data sitting on an SD card? Send it to upload@trackdays.ai — RaceChrono, Harry's LapTimer, AiM, RaceBox, TrackAddict, or a plain GPS log. I'll tell you what's in it.